SA COVID WAVE COMPARISONS
17 June 2021
See
updated chart here
OBSERVATIONS
Please note that this article is not meant to make any predictions, as anything could happen. What follows are a few of the observations based on the above chart.
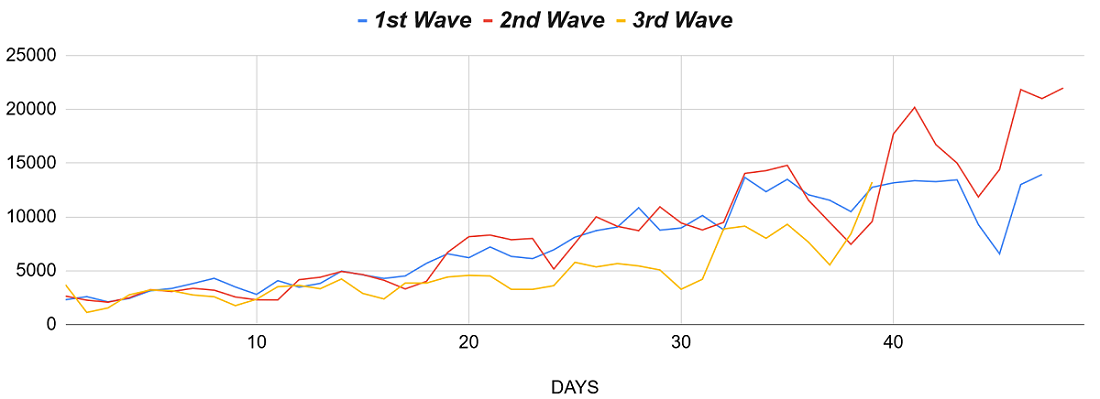
- Initially it looked like the current wave was lagging the first two waves, but at this point of the 3rd Wave (17 June 2021), it appears that the daily Covid numbers 39 days into the wave are at the same levels as the first two waves.
- The 2nd Wave was considerably worse than the 1st Wave as it approached its peak. Could the third wave be even worse?
- We are 39 days into the current wave. The 1st wave took 47 days to reach its peak and the 2nd wave 48 days. If the current wave were to follow the same trend, the peak will be around the 27th June (for calculation of beginning dates please see chart specs below) but there certainly is no guarantee of that (especially given the slower run-up in the first part of the third wave).
CHART SPECS
- Stats taken from John Hopkins University
- The criteria we have chosen for the start date of a wave is that it starts the day after three consecutive days above 2000 daily cases
- The wave ends at the day of max cases for that cycle. It could be more accurately described as "first part of wave".
- Where data is missing for certain days, the subsequent day's stats have been halved and spread over both days


