SOUTH AFRICAN COVID: THIRD WAVE CHART
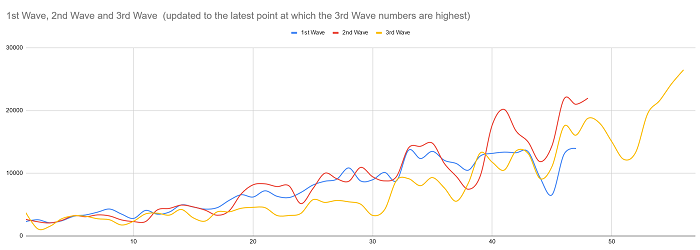
In keeping with the first two waves (which only recorded data up until the peak), this chart is only updated up until the day of its highest number of infections which was day 56 with 26485 infections. If this number is exceeded (hopefully not!)the chart will be updated again.
CHART SPECS
- Stats taken from John Hopkins University
- The criteria we have chosen for the start date of a wave is that it starts the day after three consecutive days above 2000 daily cases
- The wave ends at the day of max cases for that cycle. It could be more accurately described as "first part of wave".
- Where data is missing for certain days, the subsequent day's stats have been halved and spread over both days


